Monitoring Caddy with Fluent Bit and Prometheus
The most important tool for planning and understanding the impact of changes, is the ability to measure what is actually happening.
After deploying this website, as I described in my previous post, I was confronted with the question of what to do next. I have a list of potential next steps at the end of the post, but as I was working through them, one thing stood out. A lot of those next steps have to do with performance, and planning for the future where there might be greater loads on the system. Also, each next step adds complexity to the stack. The most important tool for planning, understanding the impact of changes, and dealing with the consequence of complexity (← bugs) is the ability to measure what is actually happening. Therefore, what we need is to install telemetry and monitoring, so that we can see issues and make plans based on actual data. As always, please let me know of any errors.
Configure the Prometheus service
Prometheus is a popular open-source systems monitoring and alerting toolkit that is also supported by Caddy, which is the part of our system that needs the most monitoring at the moment. It has an official Docker image that we will use for our deployment. It's a very simple image—you run it and it gives you a front end at localhost:9090.
One thing that I recommend doing before you start is setting up an A record on your DNS for a subdomain through which you will access Prometheus. I went with metrics.marctrius.net, so that I can use paths for different UIs like Prometheus and Grafana (if I ever add it).
Add Prometheus to docker-compose.yml
services:
  ...
  prometheus:
    image: prom/prometheus:v3.1.0
    restart: always
    volumes:
      - prometheus_data:/prometheus
      - ./prometheus:/etc/prometheus
    networks:
      - web
      - private
...
volumes:
  prometheus_data
docker-compose.yml
Set up Prometheus configuration
We are going to try to start with a very minimal configuration, so that we can build it up and out as we learn and better identify our needs. Create the file ./prometheus/prometheus.yml with the following:
global:
  scrape_interval: 15s

scrape_configs:
  - job_name: Prometheus
    metrics_path: /prometheus/metrics
    static_configs:
      - targets: ["monitoring.marctrius.net"]
prometheus.yml
All we're doing here is setting the intervals at which to scrape targets to 15s, down from the 1m default, and pointing at Prometheus' own metrics to scrape.
Configure Caddy to route requests to Prometheus
Now comes the best part: we are going to configure Caddy to direct client requests to the Prometheus UI, which we will use to monitor Caddy, even as it proxies the data from its metrics endpoint to Prometheus…
...
https://monitoring.marctrius.net {
  reverse_proxy /prometheus/* prometheus:9090
}
Caddyfile
When I tried standing up Prometheus at this point and navigating to the Prometheus UI at https://monitoring.marctrius.net/prometheus I got a 404 Not Found. After a little bit of thinking (something that is better to do up front, but unfortunately must sometimes be done after the fact when you be Russian ahead) I realized (with the help of this forum post) that Prometheus is expecting to run on the web root, and all of its paths and redirects are based on that assumption. Fortunately, Prometheus has some command line options to handle the scenario of running in a subfolder. Add this to the service definition in docker-compose.yml, but be sure to add the options specified in the original Dockerfile, because they will be overridden:
services:
...
  prometheus:
    ...
    command:
      - --web.external-url=https://monitoring.marctrius.net/prometheus
      - --config.file=/etc/prometheus/prometheus.yml
      - --storage.tsdb.path=/prometheus
docker-compose.yml
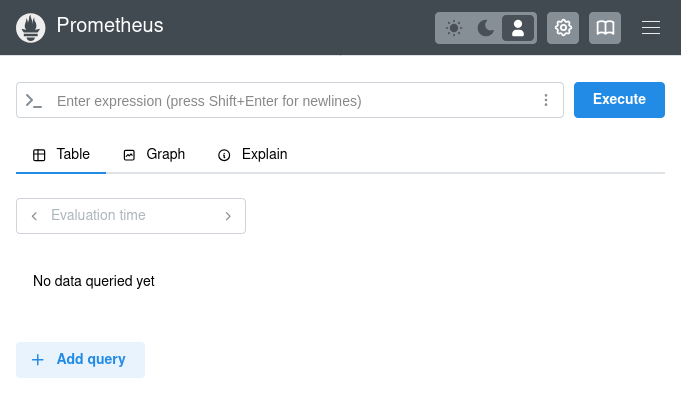
Voilà! It works:

Consume Caddy metrics in Prometheus
First of all, create an A record for the proxy subdomain, where the Caddy metrics endpoint will be exposed. I'm using a subdomain because eventually I might want to use other features of Caddy (such as its forward proxy) that will require exposing more endpoints.
While you wait for the DNS record to propagate, add this to the scrape_configs section in prometheus.yml:
scrape_configs:
  ...
  - job_name: Caddy
    static_configs:
      - targets: ["proxy.marctrius.net"]
prometheus.yml
When I first enabled the metrics endpoint, I got a 403 Forbidden in Prometheus. It turns out that we have to enable the host we're using as an origin. Here's the correct configuration:
{
  servers {
    metrics
  }

  admin {
    origins proxy.marctrius.net
  }
}

...

https://proxy.marctrius.net {
  reverse_proxy localhost:2019
}
Caddyfile
Secure metrics endpoints
I am not feeling great about all my system metrics being out there on the Internet for anyone to see, with or without a convenient UI. So, before proceeding further, I'm going to secure the Prometheus UI and various metrics endpoints.
First, let's ensure that metrics endpoints for Caddy and Prometheus can only be read from the local network. handle is a Caddy directive that works kind of like a switch, but without fall-through: Caddy will evaluate the first one that matches, and disregard the rest. So here we use the named matcher to catch anything that's not in the private IP ranges, and we'll respond with a nicely enigmatic 403 Forbidden, and use the default block to access the Prometheus UI. For the proxy subdomain, we'll just forbid anything at all from outside the local network, since we'll only want to access that from Prometheus itself:
...
https://monitoring.marctrius.net {
  @forbidden {
    not remote_ip private_ranges
    path /prometheus/metrics
  }

  handle @forbidden {
    header Content-Type text/html
    respond <<HTML
      <head><title>403 Forbidden</title></head>
      <h1>403 Forbidden</h1>
      HTML 403
  }

  handle {
    reverse_proxy /prometheus/* prometheus:9090
  }
}

https://proxy.marctrius.net {
  @forbidden {
    not remote_ip private_ranges
  }

  handle @forbidden {
    header Content-Type text/html
    respond <<HTML
      <head><title>403 Forbidden</title></head>
      <h1>403 Forbidden</h1>
      HTML 403
  }

  handle {
    reverse_proxy localhost:2019
  }
}
It's a little repetitive, but it works. Try visiting http://monitoring.marctrius.net/prometheus/metrics, and you'll get 403 Forbidden. We'll have to remember to update this with every metrics endpoint we expose. Oh, and if you try that endpoint and are able to access metrics, please let me know.
Configure Basic Auth for Prometheus UI
A standard approach for securing the front end, what we do at work, would be to use a VPN to connect to the front end, and whitelist the VPN IP address. However, this is a little more than what I want to do right now. Luckily, Prometheus supports Basic Authentication, although the process to set that up is not especially user-friendly. Instead of Basic Auth, which (like my innocence and optimism) has rather venerable 1990s vibes, I'd like to set up an authorization server and enable cool, trendy SSO logins, but this is going to have to go in the backlog, and probably remain there for a long, long time.
First, we need to generate a hashed password. Following the guide in the Prometheus docs, we create the following Python script on the VPS host:
import getpass
import bcrypt

username = input("username: ")
password = getpass.getpass("password: ")
hashed_password = bcrypt.hashpw(password.encode("utf-8"), bcrypt.gensalt())
with open("web.yml", "a") as f:
  f.write("basic_auth_users:\n  {username}:{hashed_password}\n"
   .format(username=username, hashed_password=hashed_password.decode()))
gen-pass.py
Then we install the required Python module and run the script:
marc@gause:~$ sudo apt install python3-bcrypt
...
marc@gause:~$ python3 gen-pass.py
username: marc
password:
marc@gause:~$ cat web.yml
basic_auth_users:
  marc:<hash>
marc@gause:~$
And finally, we move this file to ./prometheus/:
marc@gause:~$ mv web.yml ./prometheus/We'll also need to update docker-compose.yml:
services:
  ...
  prometheus:
    ...
    command:
      ...
      - --web.config.file=/etc/prometheus/web.yml
...
docker-compose.yml
After that, I validated the configuration and restarted Prometheus:
marc@gause:~$ sudo docker exec marc-prometheus-1 promtool check web-config /etc/prometheus/web.yml
/etc/prometheus/web.yml SUCCESS
marc@gause:~$ sudo docker compose down prometheus
[+] Running 3/1
 ✔ Container marc-prometheus-1  Removed                                                       0.3s
 ! Network marc_web             Resource is still in use                                      0.0s
 ! Network marc_private         Resource is still in use                                      0.0s
marc@gause:~$ sudo docker compose up -d prometheus
[+] Running 1/1
 ✔ Container marc-prometheus-1  Started                                                       0.3s
marc@gause:~$
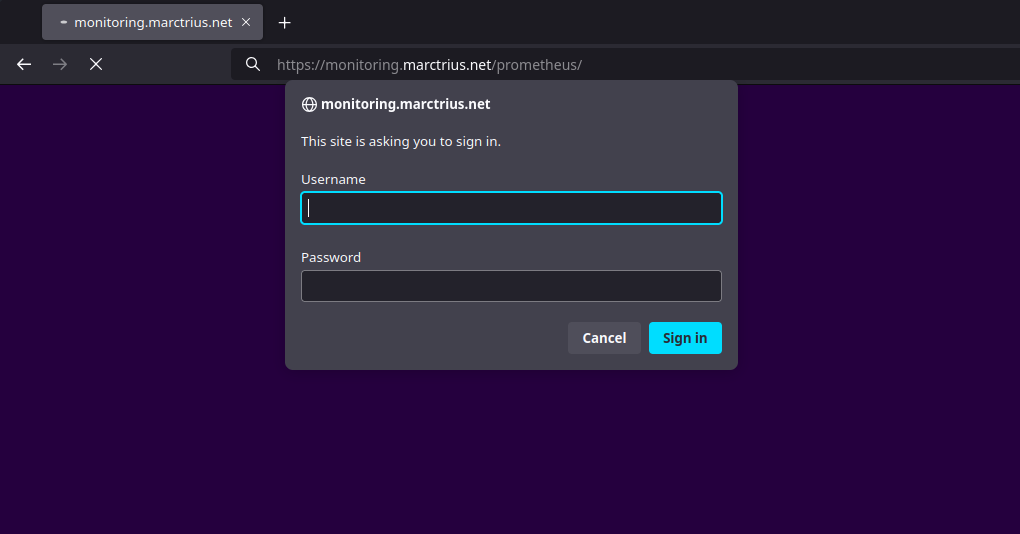
Let's try it:

Done!
Exporting Caddy request logs to Prometheus
Once I had Prometheus running and scraping Caddy metrics, I realized that I was not able to get the data I'm most interested in this way. I can get things like total HTTP requests, and a lot of metrics about the admin API, but what I'm most interested in is traffic patterns: trying to understand what applications are getting accessed, what paths, etc. In other words, I want to analyze Caddy access logs.
So I looked around. I found some solutions that were unmaintained (grok_exporter, json-log-exporter), some that were just too much for my modest, unassuming, non-Enterprise needs (Grafana Loki), and some that were very cool but didn't integrate with anything (GoAccess). In the end I landed on Fluent Bit, because it's lightweight, well-supported, actively maintained, and powerful.
Configure Caddy to write logs to file
Getting the logs from Caddy into Fluent Bit is simple. First, we'll add a logging volume so that we have one place where all our logging applications can write, and we'll mount it into the Fluent Bit container for it to consume.
services:
  ...
  caddy:
    ...
    volumes:
      ...
      logs:/var/log
...
volumes:
  ...
  logs:
...
docker-compose.yml
Then, we'll configure Caddy to write logs for marctrius_net into this volume:
...
https://marctrius.net {
  log marctrius_net {
    output file /var/log/caddy/marctrius_net.access.log
  }
  reverse_proxy marctrius_net:2368
}
...
Caddyfile
Consume Caddy log file with Fluent Bit
The next step is to add Fluent Bit into our stack. We'll write a simple configuration for Fluent Bit. At this point all we are going to do is read the Caddy log and validate via stderr.
Create fluent-bit/fluent-bit.yml:
pipeline:
  inputs:
    - name: tail
      path: /var/log/caddy/marctrius_net.access.log
  outputs:
    - name: stdout
      match: '*'
fluent-bit.yml
Now we'll add the container to docker-compose.yml and ensure that Fluent Bit has the shared logs volume mounted, and is reading the correct configuration file:
services:
  ...
  fluent_bit:
    image: fluent/fluent-bit:3.2.4
    volumes:
      - logs:/var/log
      - ./fluent-bit:/fluent-bit/etc/
    command:
      - "/fluent-bit/bin/fluent-bit"
      - "-c"
      - "/fluent-bit/etc/fluent-bit.yml"
...
docker-compose.yml
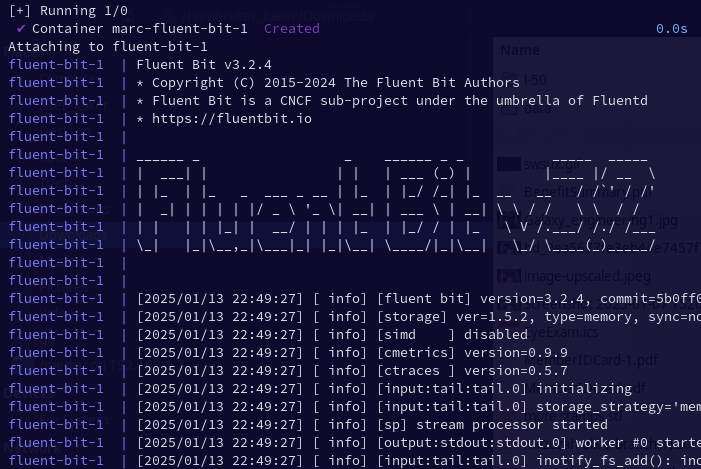
Now we'll stand it up, without detaching so that we can see the output:
marc@gause:~$ sudo docker compose up fluent_bit
inotify_fs_add(): inode=7516591186 watch_fd=1 name=/var/log/caddy/marctrius_net.access.log
fluent_bit-1  | [2025/01/13 22:48:31] [ info] [output:stdout:stdout.0] worker #0 started

Very cool. I love it when they reward you for using their software with ASCII Art, an elegant form for a more civilized age... Try to refresh your website, and watch the logs come in. At the moment, they are not very helpful; but we will work them into shape in a bit.
Parse Caddy logs
Fluent Bit has parsers that can be inserted in the data pipeline to deserialize the data coming in for further processing, that can be configured in its configuration. It comes with built-in parsers based on JSON and regular expressions. Since Caddy is outputting data in JSON format, we will configure the appropriate parser for its logs:
parsers:
  - name: json
    format: json
pipeline:
  inputs:
    - name: tail
      tag: marctrius_net_access
      path: /var/log/caddy/marctrius_net.access.log
      parser: json
...
fluent-bit.yml
You might notice that I also added a tag field to the configuration—this way, we'll be able to eventually manage multiple inputs and not confuse them.
Export Prometheus Metrics from Fluent Bit
To transform the logs we are collecting to Prometheus metrics, we will use the log_to_metrics filter. We'll need a separate instance of this filter for each metric we want to collect. To start, we'll just collect the total number of requests, grouped by host, method, and response status. We'll also add a prometheus_exporter output with default settings, which we will later scrape.
...
  filters:
    - name: log_to_metrics
      match: 'access_*'
      tag: access_metric
      metric_mode: counter
      metric_name: total_requests
      metric_description: Total requests
      add_label: host $request['host']
      add_label: method $request['method']
      label_field: status
  outputs:
    ...
    - name: prometheus_exporter
      match: access_metric
prometheus.yml
Note that the log_to_metric_filter, according to the Fluent Bit docs, is experimental and "not recommended for production use. Configuration parameters and plugin functionality are subject to change without notice." This isn't a super critical system, and lacking other great options, we'll just have to be careful when we update.
Import Metrics into Prometheus
To get those metrics into Prometheus, we'll need to do a few things. First, we'll update the Caddyfile:
...
https://proxy.marctrius.net {
  ...
  handle /access/metrics {
    uri strip_prefix /access
    reverse_proxy fluent_bit:2021
  }
...
}
Caddyfile
Next, we'll add the Fluent Bit endpoint to Prometheus as a target:
...
scrape_configs:
  ...
  - job_name: access
    metrics_path: /access/metrics
    static_configs:
      - targets: ["proxy.marctrius.net"]
prometheus.yml
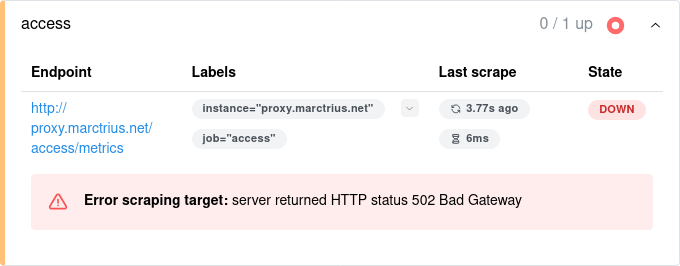
Bring the services down and stand them up again, and look at the target health screen in Prometheus:

It's not working! For some reason, Prometheus can't reach the Fluent Bit metrics endpoint. What happened?
Hmm. The reverse proxy settings in Caddy seem correct. Let's see if Fluent Bit is running and exposing the port. We have to make the request locally because of the proxy access settings, so first we'll get the container IP from docker inspect, and then use that to make a curl request:
marc@gause:~$ sudo docker inspect   -f '{{range.NetworkSettings.Networks}}{{.IPAddress}}{{end}}' marc-fluent_bit-1
172.18.0.5172.19.0.5
marc@gause:~$ curl 172.19.0.5:2021/metrics
# HELP log_metric_counter_total_requests Total requests
# TYPE log_metric_counter_total_requests counter
log_metric_counter_total_requests{host="marctrius.net",method="GET",status="200"} 2
Looks fine. What's going on then? Let's see if we can reach fluent_bit from the caddy container:
marc@gause:~$ sudo docker exec caddy apk add curl && curl fluent_bit:2021
...
OK: 13 MiB in 30 packages
curl: (6) Could not resolve host: fluent_bit
OK, let's look at the network configuration in docker-compose.yml. There's the problem! It turns out that I forgot to configure the fluent_bit service with any networks, which means that it is on the default bridge and not accessible by hostname from Caddy. Add the networks:
...
  fluent_bit:
    ...
    networks:
      - web
      - private
...
docker-compose.yml
And after a bit of a wait, check Prometheus:

There we go. Now it works, and we can go back to the Query tab and play around to see what we can learn from our new metrics.
Next Steps
I don't know about you, but I think that this post has gotten long enough! However, there is still a lot to learn and do on the subject of monitoring and logging. Here are some next steps.
- Add more useful request metrics. In this post, I added only the most basic metric from the Caddy access log: the number of requests, response status, and http method. I'll need to analyze my requirements and add more interesting metrics, like request duration histograms, some kind of request source analysis, protocols, ports, etc. Depending on where I focus my efforts, I might discover interesting things about my website and who is reaching it and why.
- Learn to use Prometheus effectively. The next step after setting up those metrics is, of course, to learn how to use Prometheus to glean information from those metrics and be alerted to time-sensitive incidents. This kind of learning takes time, and just having to deal with issues that come up. In my experience solving real problems is how you really discover what's important, what isn't, and what's the best way to triage and investigate.
- Monitor Ghost via Fluent Bit, MySQL via the Prometheus MySQL Exporter, and Docker via cAdvisor. Beyond the request metrics that we can get from Caddy logs, we'll want to take a close look at what we can learn from Ghost, MySQL, and Docker about the performance and condition of our system.
- Add centralized log management for triage. In a production system, things will inevitably come up. Monitoring will help us to identify where there's a problem, and where and how we can make improvements to the performance and cost-effectiveness of our system. But sometimes it will be necessary to dig into the logs to triage bugs and other problems. A centralized log management and analysis platform will be a great help in doing that. At work, I have mostly used Splunk, but for that's way too Enterprise for this project. Instead, we'll need to find a right-sized, open-source solution that we can host and configure ourselves.
